
Bring Instant Clarity to Business Objectives
How to use metric trees as a communication tool
Before getting into data engineering I tried my hand at data analysis. I hated it.
I just couldn’t figure out what people wanted out of data. Whatever questions I could answer led to more questions and whatever features I could add to a dashboard led to even more feature requests.
It was incredibly frustrating.
Even when I asked people what they wanted, gathered data requirements, built and released multiple reports and dashboards it never seemed to satisfy. On top of that, the dashboards wouldn’t even be used.
This led to frustration on both sides and ended with me abandoning the analyst role in favor of data engineering. I thought I wasn’t cut out for it.
It wasn’t until I got introduced to metric trees that I realized I this was exactly what I had been missing. All I needed was a framework for mapping data requests to business objectives.
As you know I have talked about metric trees (aka KPI trees) multiple times in my posts but never in the context of bringing clarity to business objectives. And to understand how, we first must let go of a misconception.
A common misconception
As a data professional with multiple years of experience you’ve probably gotten burned a few times jumping through hoops to answer a seemingly very important last minute question only to find out later that it was a mere curiosity.
Given such harrowing experiences, it’s really easy to assume executives don’t know what they want, especially when they keep changing their minds, never use the dashboards we make and keep asking more questions.
But we’d be wrong. Executives know exactly what they want, they just can’t communicate it in a way that data teams can understand. What they really want is to understand the causal relationships between the inputs (levers) that they control to the outputs (goals and objectives) of the business.
Rather than relying on the data team for this, they want to do it themselves. In fact, all their questions can be boiled down to “can you give me some data with x, y and z features so I can see if I stumble upon a lever I can pull to drive the outcomes I want?”
You can use simple metric trees as a tool to help stakeholders clarify their data requests in a way that makes you seem like an expert and them feel smarter.
Here’s how to do it.
How to instantly bring clarity to business objectives
If you ask typical business executives what their objectives and goals are you’ll get a variety of responses. Some will know exactly what they’re aiming for and how it connects to the business goal:
“If I reduce CAC by 10% this month it will increase LTV by 15% which will make us profitable in about 9 months.”
Just look at that clarity! It’s marvelous! These people are a joy to work with for any data professional…but they are rare!
Most people’s thinking is vague. They’re either too detailed…
“If I make 30 calls a day, I can bring in 10 new customers every week”
Sure but you could also bring in zero new customers if your approach is terrible, or the leads are bad. The conversion rate is not static.
…or too abstract:
“My goal is to generate more demand”
Uhm how would you measure that? How would you drive it?
In order to bring clarity to business objectives it’s important that you as a data professional:
Understand the overall business goal (e.g. exponential growth, profitability, etc)
Understand how that goal maps hierarchically to a specific objective
Map each objective to a metric and decompose it into input and output metrics
Help stakeholders figure out which of those input metrics (levers) they can drive
Keep in mind that stakeholders aren’t used to thinking this way so it will take some trial and error to get going. The Socratic approach works best here:
You: “So what’s your objective here?”
X: “My goal is generate more demand!”
You: “Ok, how would you measure that? How would you drive it?”
X: “ I need to bring in more new leads while optimizing spend.”
You: “What if the leads aren’t that interested and convert poorly?”
X: “Hmm so maybe we should also improve the conversion rate?”
(notice how we went from one objective to three…that’s not ideal)
You: “Ok, let’s map that out. New Leads = Traffic x Conversion Rate”
X: “Yeah that looks good.”
You: “Do we just want new leads?”
X: “No, we want more customers, but sales is in charge of that.”
You: “Sure. but don’t you think we can help with higher quality leads?”
X: “YES! Higher quality leads is a much better metric”
You: “Ok how should we measure that?”
….and so on.
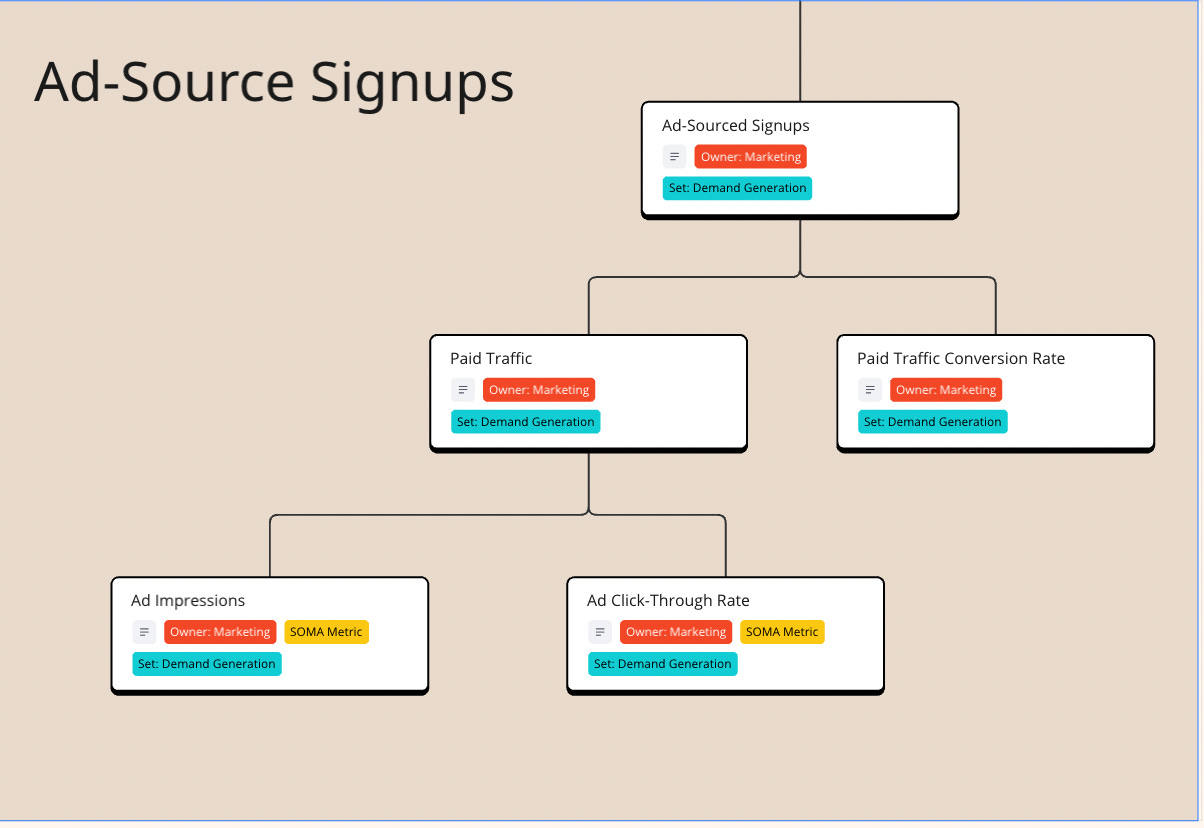
You can now draw up your very first metrics tree! Even if it’s just a diagram, it helps bring instant clarity to a previously vague business objective. The executive in charge feels much smarter (they can show their tree to their manager and explain what they’re doing).
While you as a data professional can now help them focus their efforts on how to drive the objective with data. How’s that for showcasing the value of the data team?
If you found this useful let me know. I’ll post some actual stories from my career.
Until next time.
Thank you for this. This is the kind of info people need. Not more stuff about how to build a chat bot or am LLM.
You need requirements first before you build anything and you need to know the why to help define the what
“What they really want is to understand the causal relationships between the inputs (levers) that they control to the outputs (goals and objectives) of the business.”
Perfectly described.