
Introducing the Metrics Playbook
Making analytics fun again.
Welcome to the latest issue of the data patterns newsletter. If this is your first one, you’ll find all previous issues in the substack archive.
In this edition we’ll talk about my next big project — dubbed the metrics playbook —what it is and how it came to be. I don’t have a SQL pattern this week as my focus has been on this project.
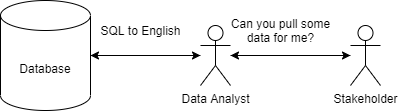
Analytics professionals have always seen themselves as oracles of business insights, advisors and strategic partners who deserve a seat at the main table, but that’s not how they treated.
In many organizations they mostly take orders to pull data, design dashboards and sometimes produce insights. Many end up as glorified English to SQL translators. Without a way to see the impact of their work morale is low.
For the longest time I couldn’t figure out why, until I stumbled upon Wardley Maps. I’m not going to bother you with the details, you can read my introduction here. I’ll get straight to the point.
Wardley states that there’s a natural evolution of activities and practices from Novel to Emerging to Good and finally Best. Every practice has gone through this: Accounting, Finance, Marketing, Software engineering, etc. so it’s natural that Data Practice follow in the same steps.
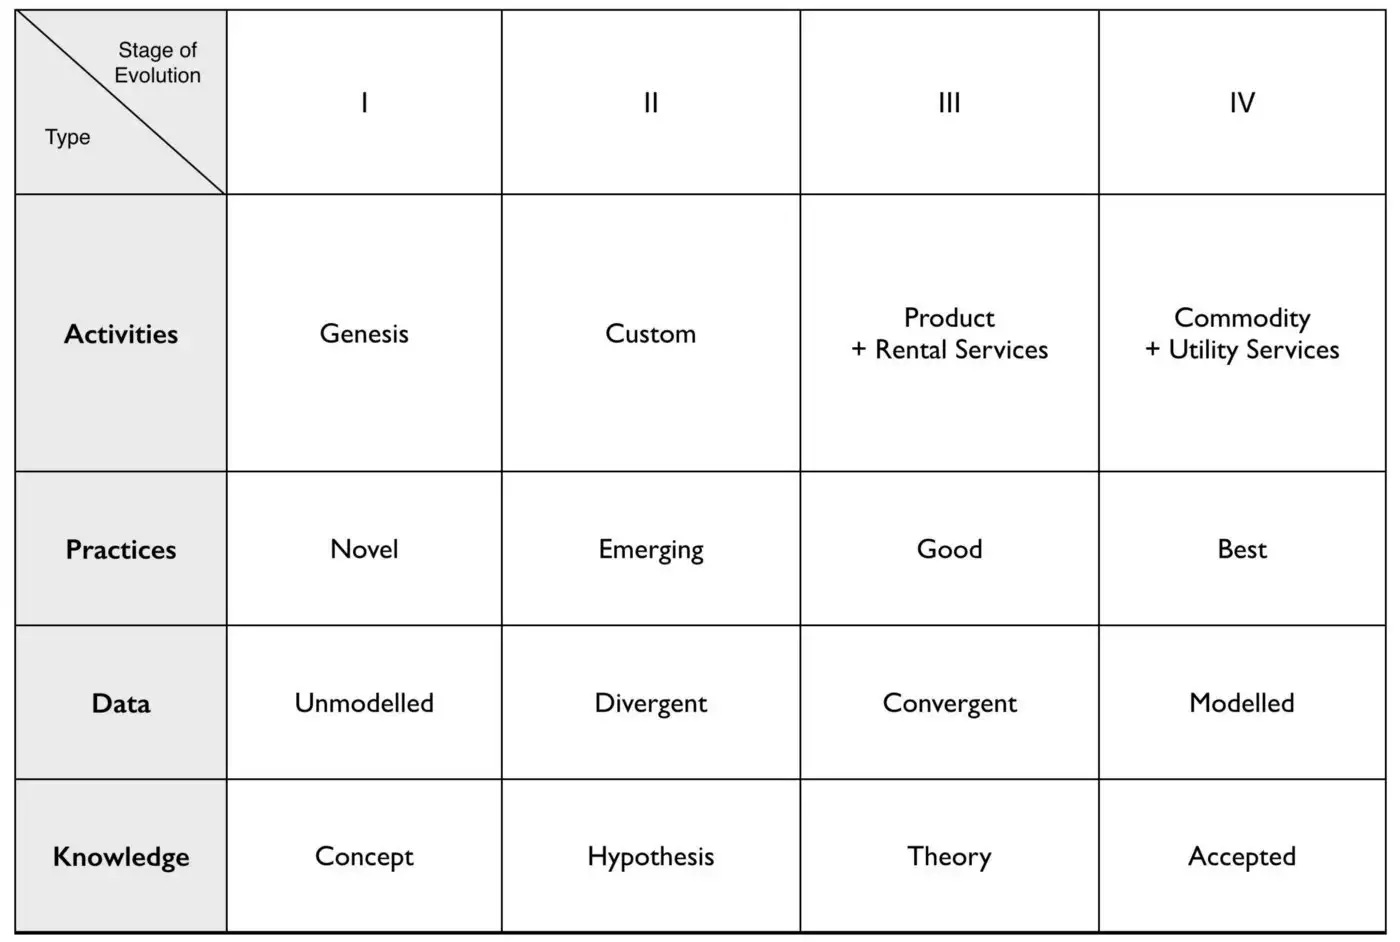
Why does this happen? If a practice is useful, it will eventually become standardized and finally taught in schools.
After reading this, I immediately realized that Data as a practice is quite new so what we’re seeing are growing pains as the practitioners continue to refine it. Therefore it must be somewhere between the Emerging and Good stages.
Why?
Ask any data leader or practitioner what the best practices are in the field, and you’ll get different answers. Ask the same thing from an accountant or finance leader and you’ll get the exact same answers (or very similar)
That should be enough evidence to understand that claim.
Naturally the next question that comes to mind is how to evolve the field towards accepted best practices. But to answer that question, we need to first figure out and agree upon what the value of analytics is.
I’ve interviewed data leaders and practitioners alike and as expected the answers were quite varied:
Generating insights
Making recommendations
Building models
Driving decisions
Modeling data
etc.
I wanted to coalesce all these answers to a singular aim that would act as a moral imperative to get data practitioners excited about their careers and make analytics fun again. So here goes:
The ultimate goal for analytics is to drive operational excellence.
There is a lot to unpack here.
Operational excellence is a term invented by Dr. Joseph Juran in the early 1970s when he was teaching Japanese business leaders about quality. It applied primarily to manufacturing, but the core of the idea extends beyond the factory into the digital realm.
Operational excellence is the practice of optimizing business processes to improve both the quality of products, services and customer satisfaction. By making quality the primary goal and building a culture of constant improvement, organizations grow more sustainably.
In order to optimize business processes they need to be instrumented and measured and that’s usually done through metrics.
If you have worked in multiple organizations, you might have noticed that the same discipline will often use the same metrics. For example paid marketing often uses Return on Ad Spend (ROAS) regardless of the org.
What if this idea extends beyond single disciplines? What if it applies across orgs that have the same business model?
This is where the Metrics Playbook comes in.
It starts with the insight that at their core organizations are not that unique. They generally fall within a limited number of business models (SaaS, eCom, marketplace, professional services, hardware, etc.)
As such, many of the core business processes are the same across the orgs as long as the business model is the same.
For example in a SaaS business, a customer performs just a handful of core activities:
Sign a new contract
Expand an existing contract
Contract (shrink) a contract
Retain an existing contract
Churn (cancel) a contract
Resurrect a contract after churning
We can easily instrument and measure these activities and define a standard set of metrics, known as growth accounting. For example NetMRR = NewMRR + ExpensionMRR - ContractionMRR - ChurnMRR.
This allows us to track and improve the efficiency of the SaaS growth engine independent of the actual business. We can build dashboards and institute a weekly metrics review process.
It doesn’t matter what specific software you’re selling, as long as you can map your data to these activities, you get all the metrics and dashboards “for free.”
If we can define the core metrics needed for a SaaS business to drive operational excellence, we can extend that same thinking to other business models. What we end up with is a standard set of metrics that comprise a playbook applicable to all organizations.
This playbook can be used as a roadmap to quickly grow an analytics function in a startup or to standardize it in existing organizations.
I’ll write more about this topic in upcoming newsletters.
Until next time.
Data’s aspiration towards operational excellence sounds much better, more concrete than some vague notion of delivering “insights”.
I love your connection to Wardley Maps.
I would like to respectfully and excitedly tell you that this statement is only HALF of the equation: "The ultimate goal for analytics is to drive operational excellence."
If I add the bit I'm thinking of you get: "The ultimate goal for analytics is to drive rapid strategy execution and operational excellence"
I'm an "OKR Coach" (OKRs = Objectives and Key Results). I teach the OKR framework that was used originally by Intel then Google to grow their companies into the monsters they are now. Many of the top companies now use some sort of goal framework (those that don't, should!)
How do OKRs relate to data and your goal statement?
OKRs basically 'deploy strategy'. They allow you to take a valuable slice of your strategy and execute it (the trick is that they align dozens or even thousands of teams across silos to work towards a common goal)
O = Objective
KRs = Key Results (there are usually 3 to 5 KRs):
Each KR has a metric value 'starting value' and a new 'target value' (that we're aiming to move the metric to over the next (say) 3 months)
The best way to setup your KRs is to have some lagging metrics and some leading metrics. Abhi Sivasailam calls them "input and output metrics" but that sounds like the relationship/correlation is a bit too 'gauranteed' to me like plugging numbers into a formula or a items on factory conveyor belt (put thes parts in and you get that part out) so, like many OKR coaches, I use "leading and lagging metrics".
If you have leading and lagging metrics then you need to have a (from your Wardley sequence) "concept", "hypothesis", "theory" on which leading metric correlates to the lagging metric you really care about.
SIDE NOTE: Hypothesis means "educated guess" so I'd say the word that comes before that (in the Wardley sequence) isn't "concept" but perhaps it's "guess". What do you think?
So in summary the process of strategy execution is:
* Vision
* Strategy
* Results Map
* OKRs
* metics trees <<< this data is a fundamental foundation of stretagy execution - without a mature understanding of how leading and lagging metrics correlate to each other you're guessing as to what activity to do in order to execute on your strategy
BTW: I found you from this post on LinkedIn https://www.linkedin.com/feed/update/urn:li:activity:7076303052571320320?commentUrn=urn%3Ali%3Acomment%3A%28activity%3A7076303052571320320%2C7076303507376467968%29&dashCommentUrn=urn%3Ali%3Afsd_comment%3A%287076303507376467968%2Curn%3Ali%3Aactivity%3A7076303052571320320%29