
How Analytics Drives Progress
The story of Statistical Process Control (SPC)
There’s a memo sitting in the archives of Bell Laboratories. It’s barely a page long. Most of it is a simple diagram. And it is, arguably, one of the most consequential documents in the history of analytics that very few modern data practitioners know anything about.
It was written in 1924, by a physicist named Walter Shewhart, working at a telephone equipment factory in Chicago. His boss, George D. Edwards, later recalled:
“Dr. Shewhart prepared a little memorandum only about a page in length. About a third of that page was given over to a simple diagram which we would all recognize today as a schematic control chart. That diagram, and the short text which preceded and followed it, set forth all of the essential principles and considerations which are involved in what we know today as process quality control.”
Dr. Shewhart didn’t set out to revolutionize manufacturing, or give birth to Six-Sigma, TQM, Just In Time, Lean, etc. all of which still drive excellence and quality, but they call can be traced back to his work on the control chart.
He inspired the work of W. Edwards Deming and Joseph Juran, both of whom had tremendous success in post-war Japan and are credited with turning around the phrase “Made in Japan” from the laughingstock of industry to the second most successful economy in the world for a long time.
In many ways, Walter Shewhart can be thought of as one of the early pioneers of applied analytics, a field we consider quite modern but whose roots go all the way back to his invention of “Statistical Process Control” (SPC). Yes, statistics goes back even further, but its application in industrial processes began in a phone manufacturing plant at the start of the 20th century, with an American physicist and self-taught statistician.
Quiet beginnings
In 1918 Shewhart joined the Western Electric Company Inspection Engineering Department at the Hawthorne Works plant in Cicero Illinois to help with their quality issues. Western Electric produced telephone hardware for the Bell Telephone Company, which later became AT&T.
At Hawthorne Works, telephone systems roll off the assembly line. A worker inspects the apparatus testing it carefully. If it falls within tolerance limits, it’s a “go” otherwise it’s straight into the reject pile. We’re talking about a piece of hardware with more than one hundred thousand part here, getting scrapped just like that. This is not a joke!
It’s the early 19th century, and despite the concept of standardization being invented a century earlier, everything is still done by hand operated machines. Imagine making even something as simple as a screw on a lathe by hand.
Its length, diameter, number of threads, depth of the groove, etc. all standardized, and yet one small change in the process, like an extra rotation of a lathe, can cause a few tenths of a millimeter variation in length. Add up a few of these and the entire apparatus is thrown in the scrap pile.
It is precisely in this environment that Walter Shewhart gives birth to the Theory of Variation.
Controlling variation improves quality
The fact that manufacturing processes produce variation was common knowledge at this time. A machine cutting parts to a specified diameter will never cut every single part exactly the same. Temperature, tool wear, raw material variation, the vibration of the floor all of it introduces small differences. This is normal. This is expected.
Shewhart’s insight was that you can improve quality of a part by reducing that variation in its manufacturing process through the use of controllable inputs.
We don’t think about it much these days, but In order for parts to fit perfectly they need to be produced within certain tolerances. This is easy to measure: length, width, height, diameter, curvature, etc. and can be thought of as you “output measurements.”
Despite being thought of as “outputs” it doesn’t mean they can’t be controlled. You can control the diameter of a part by how long it spends in the lathe, how far the cutting tool is set, how many passes you take, how sharp the insert is, etc. By controlling these inputs, you can directly control a good portion of variation in final measurements, which means you can improve the part’s quality.
If everything is working as expected, the variation should be within an expected range (called upper process limit and lower process limit). If something unusual happens (a tool starts to get dull, there’s too much heat produced, or something breaks, you will see the change in variation. Now you can investigate.
Too many changes
Before Shewhart introduced the concept of “routine variation” vs “exceptional variation” managers would react to every fluctuation in outputs. Tighten a screw more, spin the lathe slower, use more coolant, take fewer passes, etc.
This is not much different to how we operate today.
We may not be tightening the screws of a work piece in a milling machine, but we do control how much we spend on an ad campaign, what kind of messaging we use in the ads, how quickly we reach out to customers who sign up for a trial, whether we email first then call, how often we call, etc. These are all controllable inputs for modern digital processes.
Shewhart discovered that if you keep adjusting a system that’s exhibiting only routine variation, you introduce variations of your own. You add noise on top of noise. He called it tampering, and his work showed that tampering with a stable process consistently makes it worse not better.
So he introduced a rule: “If all you see is routine variation, DON’T TOUCH IT!”
Unlike in manufacturing, where quality is visible — you can see if two parts fit together perfectly or not — we cannot see the quality in our digital processes. So we measure things we think make sense (e.g. conversion rates) and go about trying to improve them.
Exactly like the workers before the control chart, fiddling with the machines after every measurement, we tweak everything at once; we measure the impact poorly (by comparing today with yesterday or last week) and wonder why we can’t seem to figure out how to improve things.
But how do you measure routine vs exceptional variation?
Process control charts
Shewhart’s answer was the control chart. The idea is straightforward: calculate the natural limits of variation for a stable process, draw lines at those limits, and then observe where new measurements fall. Points within the limits? Common cause. The process is in control. Don’t touch it. Points outside the limits? Special cause. Something changed. Investigate.
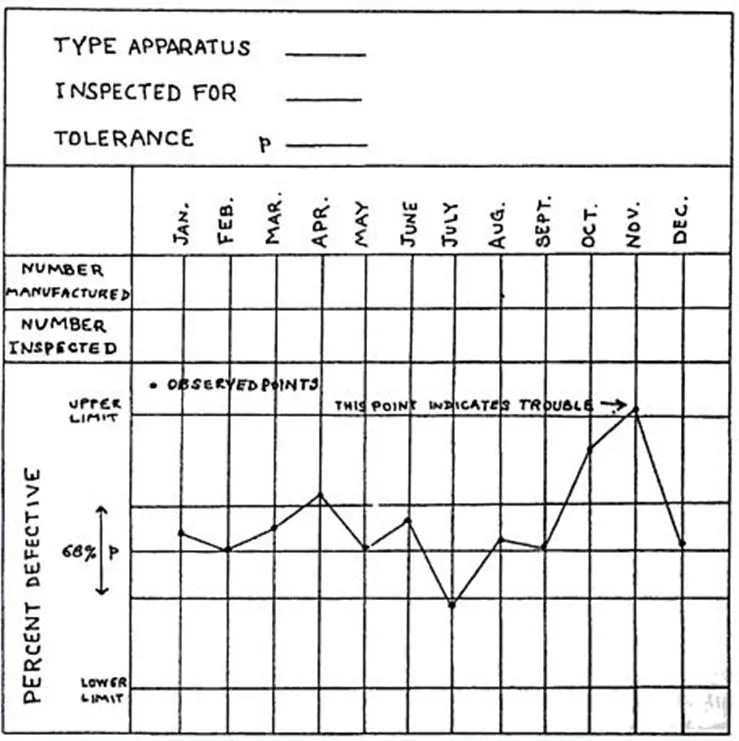
Shewhart’s original hand-drawn control chart from the May 16, 1924 memo. The upper and lower limits define the boundary between normal variation and a signal worth investigating.
For those who haven’t seen such a chart in the past, the upper and lower limits capture Three Sigma (99.73% variation or roughly 2700 defects per million). For comparison, Six Sigma captures 99.99966% variation or 3.4 defects per million. Given the tooling at the time, this was more than adequate for improving quality.
In 1931, Shewhart published Economic Control of Quality of Manufactured Product — the foundational text. It was the first publication on statistical quality control in manufacturing. The core argument: you cannot improve what you do not understand, and you cannot understand a process without distinguishing between its normal behavior and its exceptions.
The problem Shewhart solved in 1924 is the same problem analytics teams face every day. A metric drops 8% week over week. Is it a real problem? Is it seasonality? Is it within the normal range of fluctuation? Should leadership be concerned? Should the data team be investigating? Should the engineering team be checking for a bug?
So why don’t we use the framework of process control charts?
If you don’t have a framework for distinguishing signal from noise, you end up doing exactly what those pre-Shewhart factory managers were doing: reacting to every fluctuation, investing enormous effort in problems that aren’t problems, and missing the genuine signals buried in the noise.
A Preview of what’s coming
Shewhart’s memo in 1924 was the beginning. His ideas stayed largely confined to Western Electric for over a decade until World War II changed everything, and the methods proved themselves at a scale nobody had imagined.
In part two, we’ll look at what happened when Shewhart’s framework met the urgency of wartime manufacturing and how it drove one of the most remarkable leaps in industrial productivity in recorded history.
I’ll write more on this series because it’s of genuinely high interest to me, and I hope to you as well. The history of SPC is really the history of how analytical thinking learned to create accountability at industrial scale. That story is not over. It’s just getting started.
Until next time.