
Designing Interactive Metric Trees
A case study with Sergey Kornev of Brightly Software
Last month I sent an email asking about metric trees to understand what was driving this interest. I had a lot of interesting conversations, so thank you to those of you who replied and talked with me.
I love nerding out on data topics so the conversations were very enjoyable. One of the requests many of you had was on how to design interactive metric trees that cover the entire business.
That’s where Sergey comes in. We chatted last year while he was still building a metrics tree for the sales team and he was finally ready to reveal what they had built.
Sergey runs the internal analytics team at Brightly Software. The following is an edited version of a conversation we had about his experience designing, implementing and using metric trees at Brightly.
Agenda:
Why did he choose to build a metrics tree?
How specifically did he build it and how did he automate it?
How is it being used and what’s the impact to the business?
How he’s leveraging the tree to provide on-demand AI powered insights
Interested? Let’s get into it.
Why did they build a metric tree for sales?
Ergest: Hi Sergey. Thank you for taking the time to speak with me. Can you provide some context about Brightly? What does the company do?
Sergey: My pleasure! We're a B2B SaaS company selling a variety of cloud solutions to different verticals. Our largest market is probably education; we sell to schools and universities, and our focus is on asset management software. You know, when you need to submit a work order to get something fixed, that's our software.
Sergey: Before metric trees, we were very reactive. Questions would pile up and we’d scramble to answer them. We had dashboards and reports but it felt more like “choose your own adventure.” We wanted to be seen as a partner rather than somebody who just gets asked a question and provides an answer.
That’s when Sergey decided to build a metrics tree after reading my post and watching Abhi Sivasailam’s Data Council talk on metric trees.
How did they build the tree?
Ergest: I get a lot of questions about how to implement metric trees and people always want to capture the entire business in one tree. That’s not what you did right?
Sergey: Correct. We started with sales, not the full business, just sales and pipeline metrics. I think that's something I'd really recommend as an approach. With a business large enough to span different areas (sales, marketing, finance, operations) I don't know if you can or even want to capture all of it in a single metric tree.
Sergey: We knew for a fact that our sales stakeholders were really craving for that data. We had a lot of questions about how to do root cause analysis and how to figure out why are we up or down? At the same time, the North Star metric for sales (ARR bookings) is quite easy to build a metric tree for.
Ergest: What does the actual implementation look like? Can you walk me through what people see?
Sergey: What you see here just a screenshot, but the real tree is is automated and built in Qlik. You can interact with it, zoom in and out, and drill into specific branches. The colors represent how individual metrics are performing against whatever comparison you choose. It could be an average, last year same period, things like that.
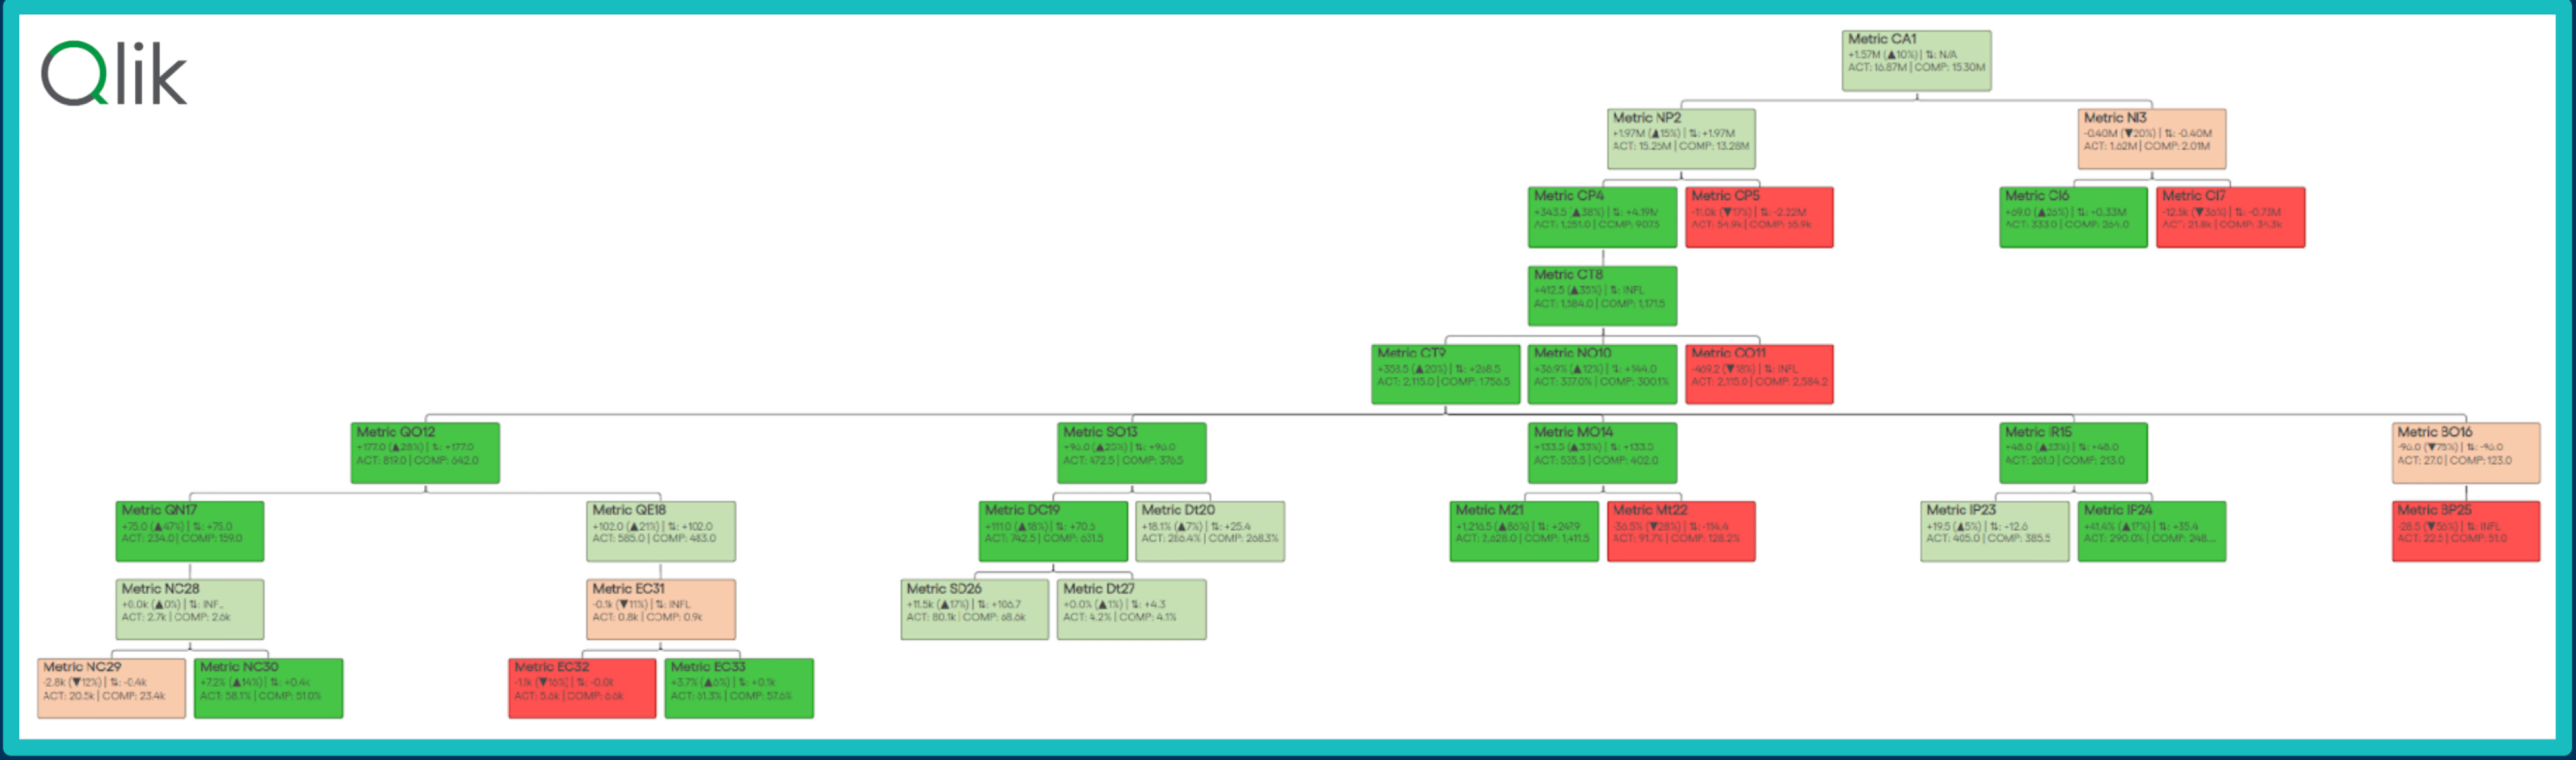
Sergey: This way you can quickly see different areas where things are performing well versus not performing as well. The intensity of the color is where we get into statistical analysis and we do a simplified version of control / XMR charts. This lets us focus on specific areas that need deeper root cause analysis.
Ergest: How did you approach the actual design of the tree?
Sergey: We followed what I think is a pretty common blueprint. Start with a familiar business area, define our North Star (ARR in our case) then break that down into direct inputs, the next lower-level components. Then rinse and repeat recursively until you get to input metrics that you have control over.
Ergest: What about those influence metrics? The ones that aren't direct mathematical relationships? How do you discover and integrate those?
Sergey: That's an interesting area where we probably need to do more research. So far, we've been gathering feedback from conversations and field notes, talking to the reps and managers to understand what they see as causal relationships.
Sergey: For example, sales cycle length. It's commonly known that the shorter your sales cycle, the more likely you are to close the deal, so your win rate should be higher. But there's no direct mathematical relationship between those two metrics.
Ergest: How long did the full tree take to build?
Sergey: For the metric tree itself about three months with just me working on it. If there was a team working on it, it would probably be quicker. But I'd say a quarter of time just to get it to something useful. Then we iterated and improved from there. You don't even need to automate it right away. Start with a diagram. Build it on paper if you need to.
Ergest: Did you interview business users to validate the structure or did your team already understand the business well enough?
Sergey: We had a pretty good understanding since we work with stakeholders day in and day out, but we still interviewed them and checked with stakeholders because we really wanted to get this right.
How did the tree impact the business?
Ergest: Has this reduced the number of questions you get, or changed how you work with stakeholders?
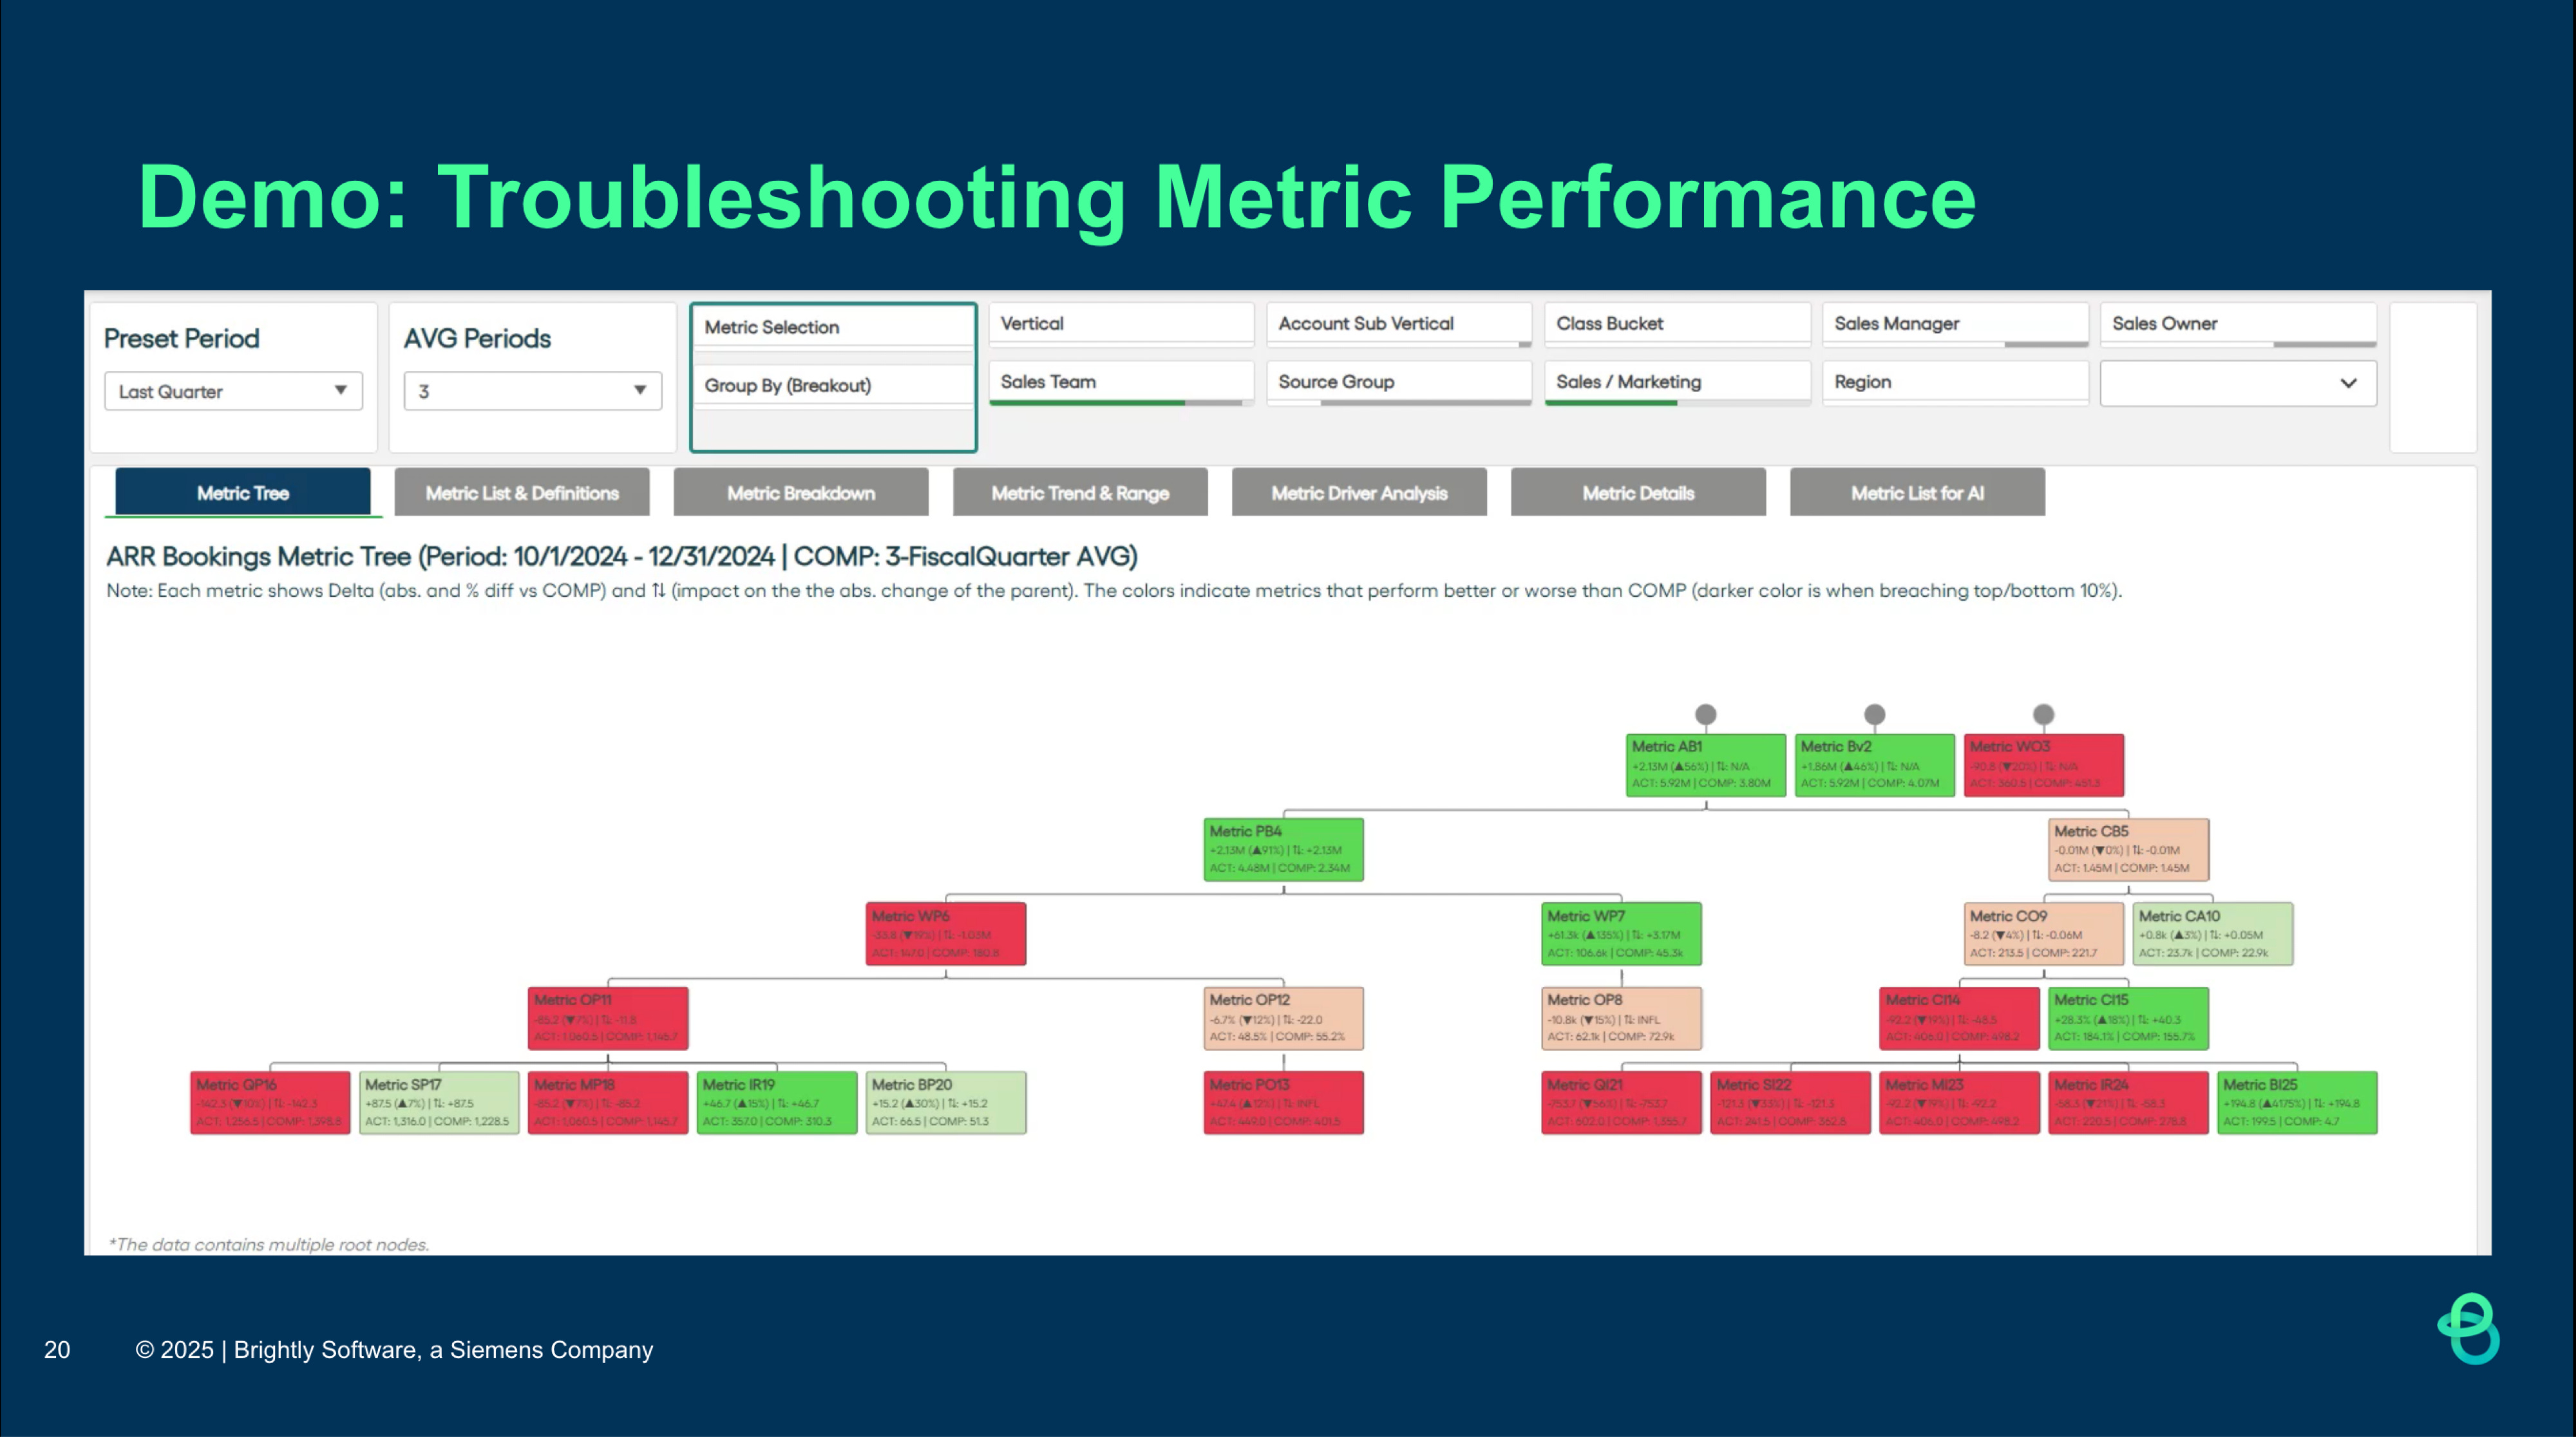
Sergey: The main use case for us as analysts is that it's helped us bring more insights to the table instead of just answers, which really helps with reducing questions and addressing some of them before they even start. We've become much more proactive. Here’s an example of doing root cause analysis using the automated reports:
Sergey: What I'd love is for more users to actually start using it as self-service, not just using it but understanding the concept and getting value so they can answer their own questions. We still get plenty of questions, but we've shifted gears from just sitting and waiting for new questions to becoming proactive and digging into well-known questions every month and quarter to give insights before anyone asks.
Ergest: Any final thoughts on the challenges or what you've learned?
Sergey: The tool is powerful, but the more powerful it is, the more overwhelming it can be for users who aren't familiar with the concept. You want to find that balance between keeping it simple but also keeping it as powerful as it is.
Sergey: When I show this to typical business users and start talking about filters and driver analysis, I can lose them on the first sentence. So you have to be careful about how you introduce it. Don't worry about root cause analysis or forecasting yet. Those are separate use cases.
Extracting automated insights with AI
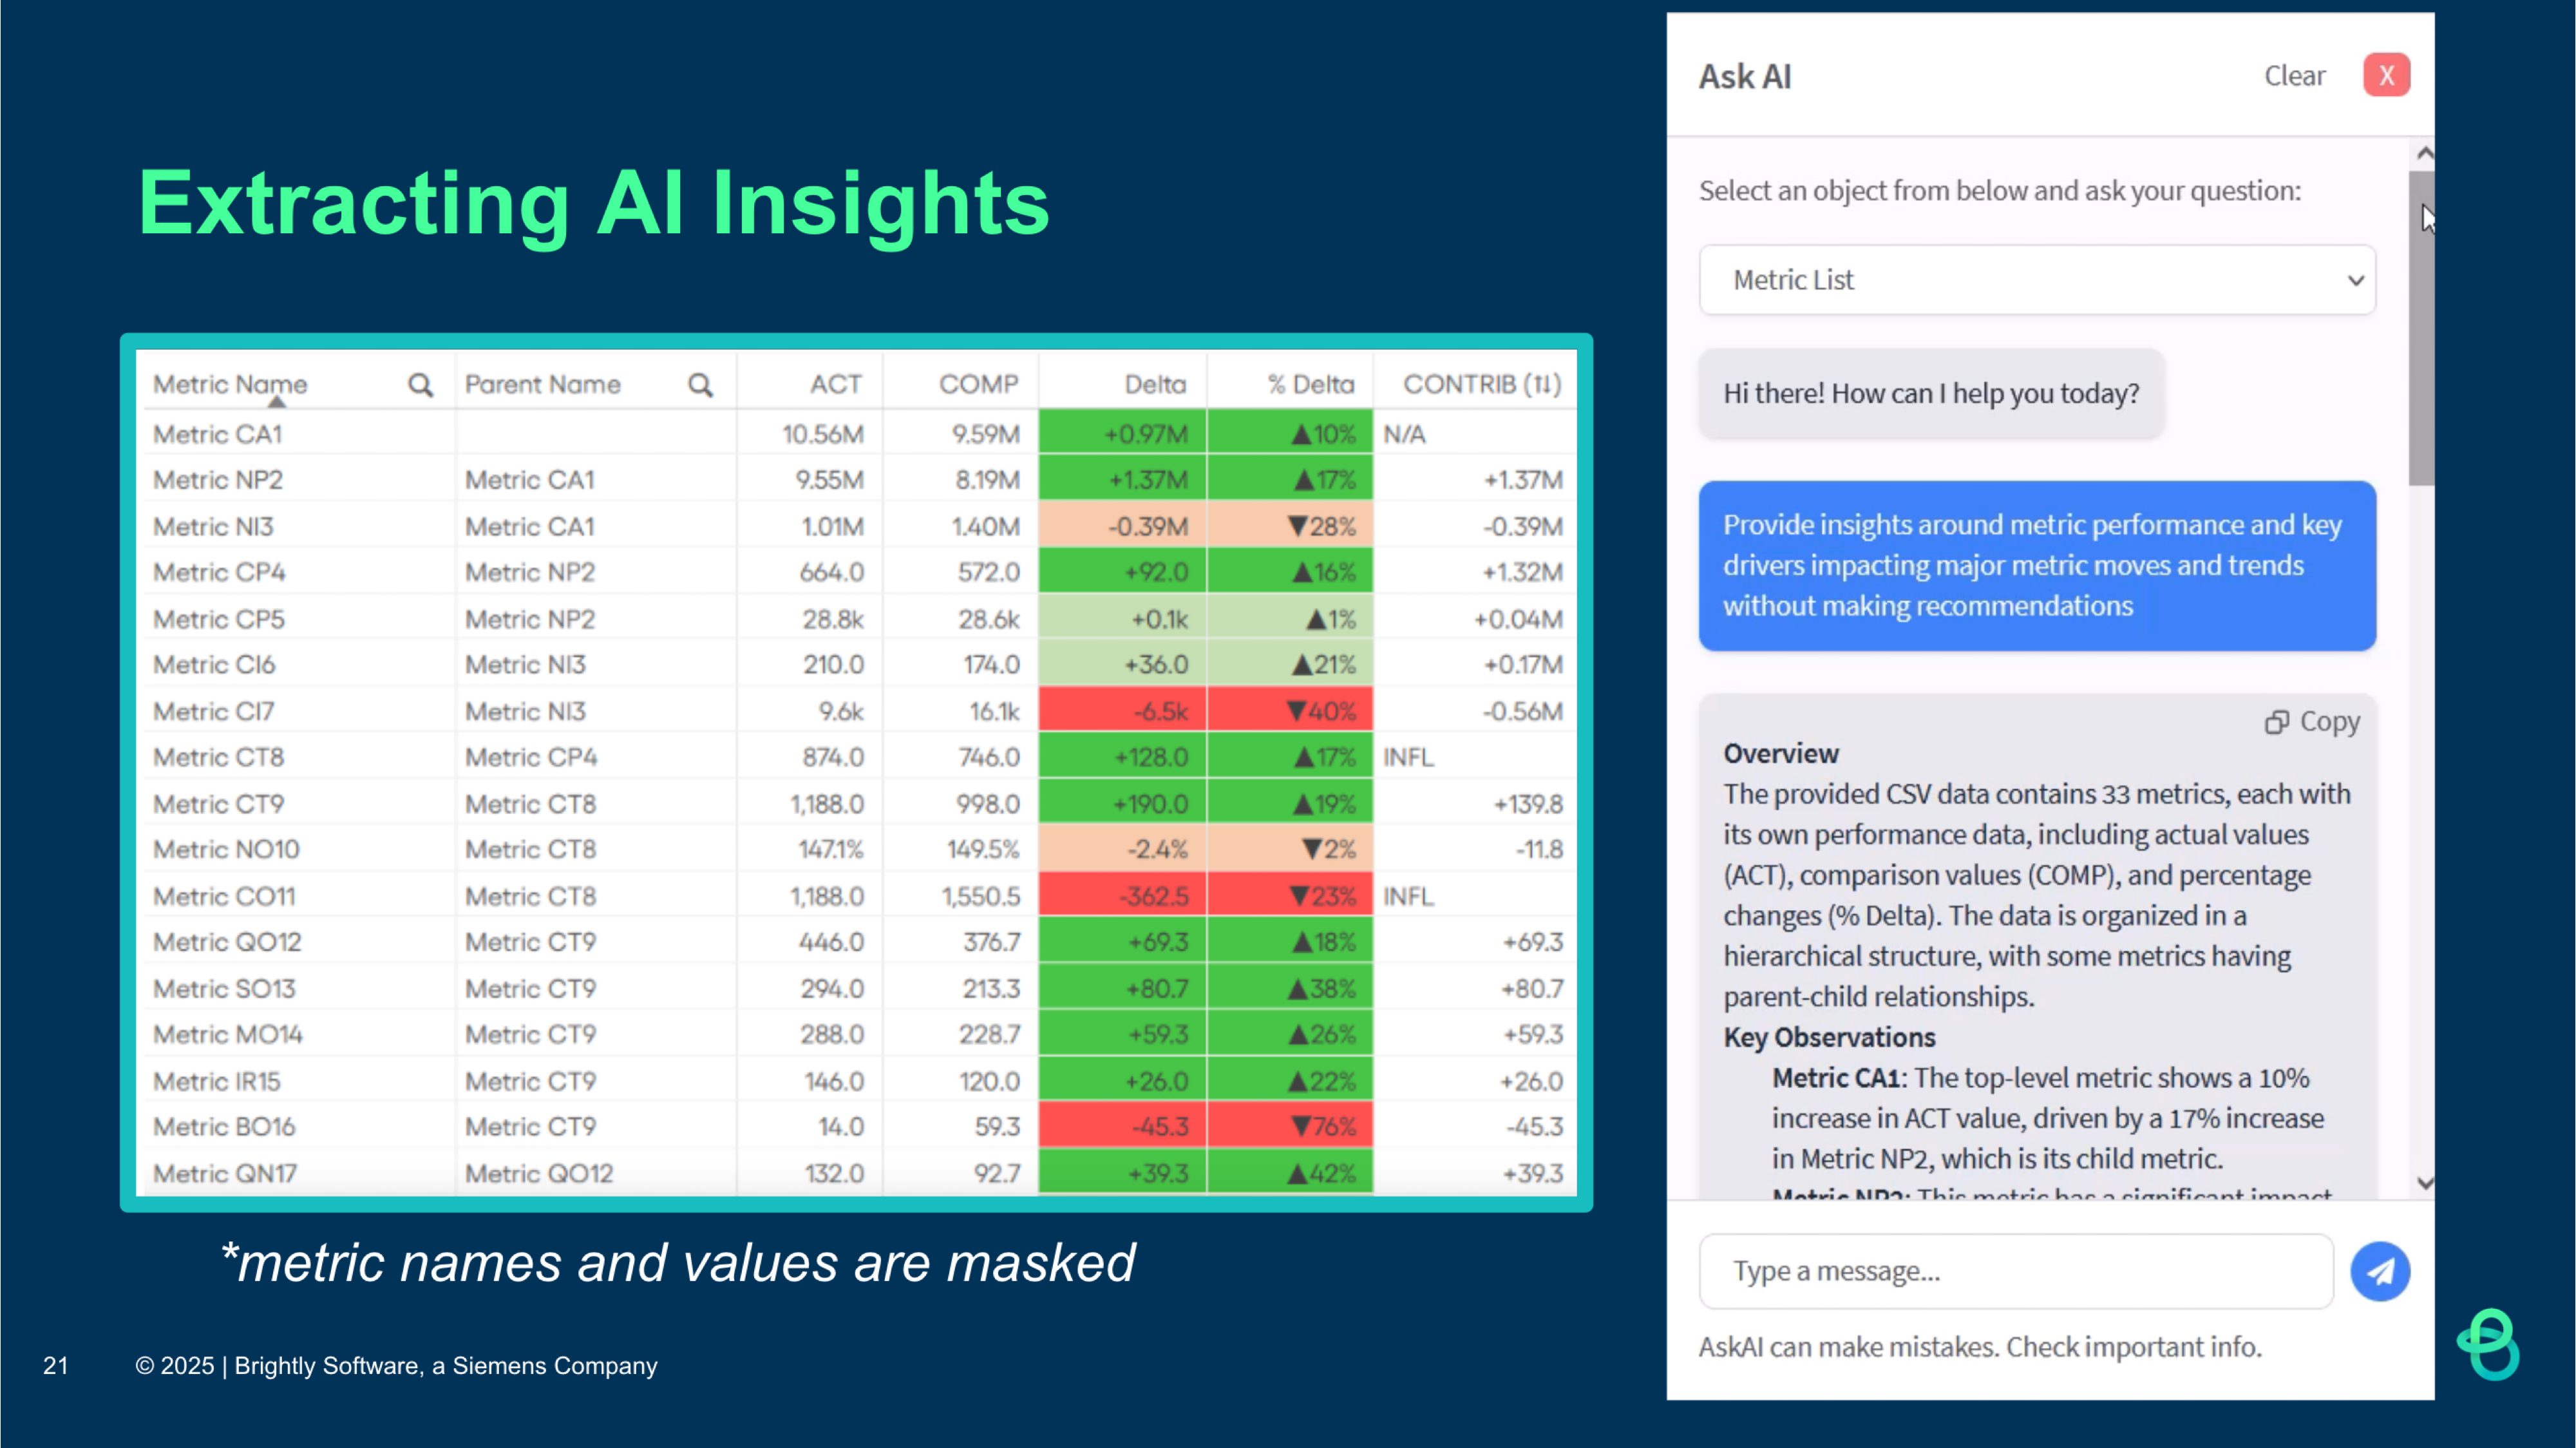
Sergey: One of the cool things about automating trees and metric definitions is leveraging AI to provide automated insights. What we’ve been able to do leveraging LLMs we can feed that data into an AI model and ask, hey, give me a summary of insights based on that metric tree data, what's driving what, what's the root causes of changes, and it actually does it. If people are interested we can do a deeper dive into that.
Ergest: Thank you so much Sergey. I appreciate you taking the time to explain your experience with metric trees. And I’m sure people would love to hear more about the AI section
Sergey: My pleasure. Maybe next time?
That’s it for this issue. If you have questions for Sergey, please send them to me via email and we’ll do another call.
Until next time
This is awesome! Thank you, Ergest, for providing inspiration for this build and helping spread the word about this fascinating topic. I hope our experience with designing and automating metric trees shows people the art of the possible, so we can see more metric trees in production soon.