
Creating Leverage with Data: How Nielsen Ratings Changed TV Shows and Ad Buys
The story of how a genius measurement drove progress in two different industries while building a billion dollar company
In case you haven’t noticed I’m rebranding this newsletter (again) as Data Wise, in order to focus on my mission to show how data is used to create leverage, power growth and drive progress.
This is the first of many such stories.
In 2007, ABC charged $419,000 per commercial during Grey’s Anatomy. CBS charged $248,000 for a spot during CSI even though CSI had five million more viewers. How is that possible? The answer begins in 1936 with a mechanical device etching marks on waxed paper tape inside a tabletop radio and a question that’s still as relevant today as it was nearly a century ago.
Timeless question
Imagine you own a business in the 1930s. You want to grow this business; to get wealthier of course, but also to provide jobs. People with jobs participate more freely in the economy which eventually leads to a thriving society. But let’s not get sidetracked.
So you’re living in the 1930s and want to grow your business. There’s no internet, no Google Ads, no Facebook Ads, no social media, no YouTube and barely any TV. You want more customers, and you know that to get more customers you need to make an ad and then run it.
But where to run it? And how much should you spend? Ads are expensive so you need to get your money’s worth. What are your options? Newspapers? There’s a few national ones but in general they have limited reach. Same with magazines.
Radio is quite popular (TV is still nascent) so you decide to run your ad during a radio program. You want your ad to be effective, of course, after all you’re spending a lot of money to produce and run it. And so we get to that eternal, timeless question: What’s the ROI of my marketing efforts? Wouldn’t it be nice if you could know exactly how many people will potentially hear (or see) your ad? Wouldn’t it be even nicer to know exactly who those people are?
Failed attempts
Unlike today where every page visit, every click, every like or dislike, every second you spend listening to a podcast or watching a video gets tracked and saved by the app, it’s very hard know. Radios and TVs are only receivers, they cannot transmit information back. A show producer might tell you their show is popular but without any hard data you’re just guessing. And guessing doesn’t lead to wise decisions. Guessing doesn’t tell you if your ad was effective. You need data.
How could you get the data?
You could call people and ask them what show did they watch or listen to last night. That’s what Archibald Crossley did in the early 1930s, creating the Crossley rating. It helped to illuminate the question somewhat even if the data isn’t as reliable. How many people remember accurately what show they watched last night?
C.E. Hooper had a better idea. He would poll people during the show’s airtime and ask them if they were listening in, creating Hooperratings. Since the answers don’t rely on people remembering, the data was far more reliable. But it still had problems. It only polled urban areas, not accounting for the rural population and it skewed heavily towards households with a telephone, still a rarity at this time.
Audimeter
Enter Arthur C. Nielsen, an electrical engineer by training, who had been producing market index data since the 1920s as part of the A.C. Nielsen Company. In the spring of 1936, Nielsen attended a Market Research Council meeting and heard a presentation from Robert Elder, an MIT professor who had built a mechanical device called the Audimeter.
It was a simple but ingenious device: a stylus connected to a radio’s tuning dial etched marks on a continuously moving waxed paper tape leaving a physical record of every station change and every on/off moment, minute by minute. You could record people’s listening habits precisely and have them ship the tapes for data processing. Realizing the potential, Nielsen bought all existing devices, the patent rights, and the trademark on the spot.
Let’s pause for a second and think about why. As an electrical engineer Nielsen understood very clearly the importance of precise measurements. He had spent the 1920s producing the Drug Index and the Food Index by literally having his people go to the stores and take note of what was in the shelves.
He understood the power of rigorous sampling, which meant you can go beyond audience counts. You can provide information about who was listening to which shows. The show runners now had accurate demographics and could charge far more for a slot during the program. At the same time, using the same data, the advertisers could track the effectiveness of their campaigns with more scientific precision.
Talk about leverage!
Nielsen Ratings
The Nielsen Radio Index launched in 1942 with an 800-household panel. It provided the most accurate record of every show people listened to and for how long. The data was then enriched with audience demographics. Later, the Audimeter was installed on TVs providing the same accurate information.
Fast forward a few decades and Nielsen Ratings have become the de-facto standard for ad buys. The company Arthur started more than a century ago, which was publicly traded up until 2022, reported revenues of $3.5 billion in 2021 before it went private. The same exact data collected in the early days of television (viewership, demographics) is still being used today to determine what TV shows are renewed or canceled and of course the price of an ad slot during a popular TV show.
In general, the number of viewers within the 18–49 age range is more important than the total number of viewers. According to Advertising Age, during the 2007–08 season, ABC was able to charge $419,000 per commercial sold during its medical drama Grey’s Anatomy, compared to only $248,000 for a commercial during CBS’ CSI: Crime Scene Investigation, despite CSI having almost five million more viewers overall. Because of its strength in young “demos” (demographic groups), NBC was able to charge almost three times as much for a commercial during Friends as CBS charged for Murder, She Wrote, even though the two series had a similar amount of total viewership during the two seasons they were on the air concurrently. Wikipedia
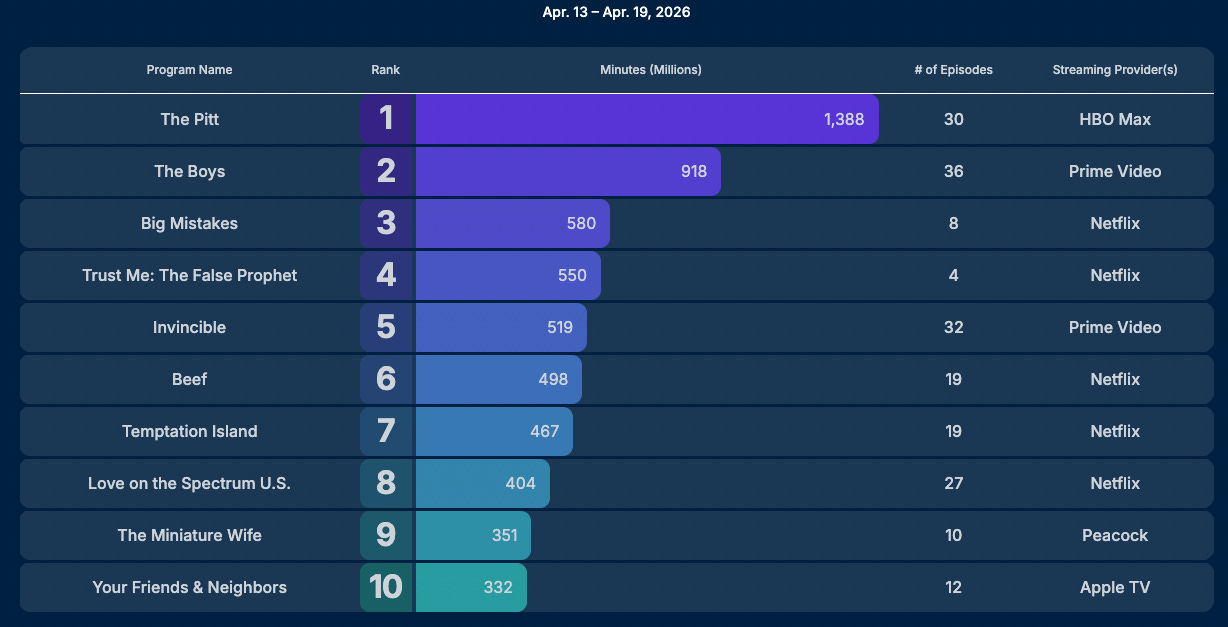
Beginning in 2020, Nielsen created the Top 10 Streaming Index, ranking the most streamed TV shows from Netflix, Prime Video, Hulu, Disney, etc.
They’re doing the same thing they did nearly 100 years ago: illuminating an important aspect of human behavior with data, incentivizing streaming services to produce better quality TV shows, incentivizing ad agencies to produce better ads and creating massive leverage in the process.
Leverage
Have you worked out what leverage Nielsen Ratings builds? Think about a measurement that’s hard to come by while also illuminating a key piece of information.
Think about the larger implications of knowing exactly who watches a TV show, which ads they potentially watch and how they react. Think about what that means for a company looking to grow. You may not like the advertising industry, but if you run (or help run) a company you cannot deny its power. Not only do you need to run ads but at the same time you need to answer that timeless question “what’s the ROI of my marketing?”
Essentially the pattern is this: “an opaque market with latent demand (in this case ad buys for radio and television shows) gets illuminated by data” thus creating massive leverage for the company providing the data. You will see this pattern repeat over and over again in future cases. Stay tuned!
That’s it for this issue. If you liked it or found it useful, let me know.
Until next time.
Love these — keep them coming